John Alden Knight brought the solunar theory to pen and paper in “Moon Up, Moon Down” in 1926. The theory was first introduced to the outdoorsman by a fishing buddy who used a similar method fishing and hunting. After John witnessed the phenomenon for himself he became committed to explaining how to use this theory for fish forecasting.
Solunar Force and Major Periods
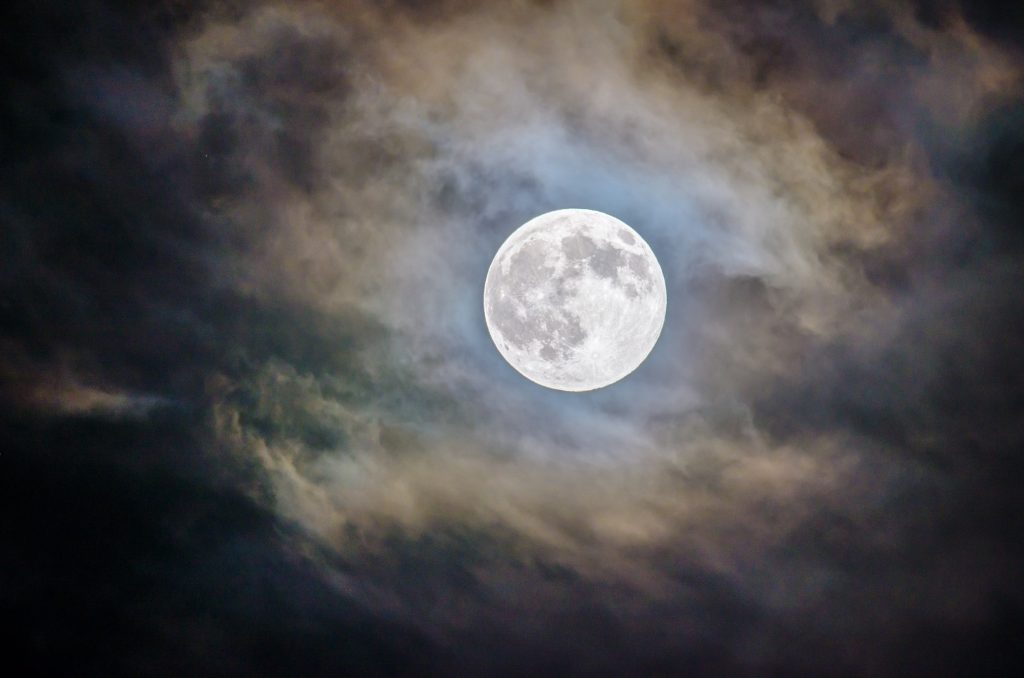
Based on solar and lunar position, there are four time periods during the day when animals will be more active. The sun and moon are directly above each other twice a day, when the moon is directly above the sun-moon up, and when the moon is directly below the sun-moon down. These two periods create the highest solunar force that acts upon animals. This causes them to be the most active, and these two periods are known as the major periods. When the moon is sitting on the horizon, either rising or setting, it creates a solunar force. This force is not as strong as the major periods and is known as a minor period. Depending on the moon phase there are not always four periods a day.

Increasing Your Catch Probability
When the solunar theory pairs with general knowledge of what causes animals to move you can greatly increase your catch probability. Furthermore, when the weather is good, barometric pressure is high or going up, it is near dawn or dusk (it is natural for animals to feed during dawn and dusk) and it is a major solunar period you will have the highest catch probability. Which is why we incorporate the solunar theory as a Fish Forecast.
The Fish Forecast Feature
To view the Fish Forecast, click on the “Forecast” button on the bottom of the main navigation of the FishAngler app. You can then search for your desired body of water. Once you select the body of water the entire forecast will populate the screen and show the current forecast detail for each forecast section. To see the full detail of the fish forecast, click on Fish Forecast. When the Fish Forecast section opens it will show you the entire day’s run down of the fish forecast.
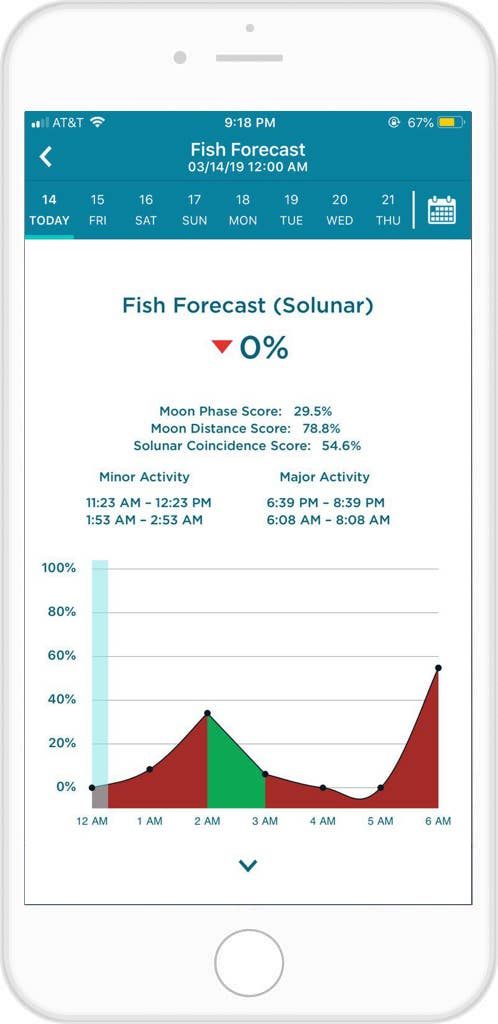
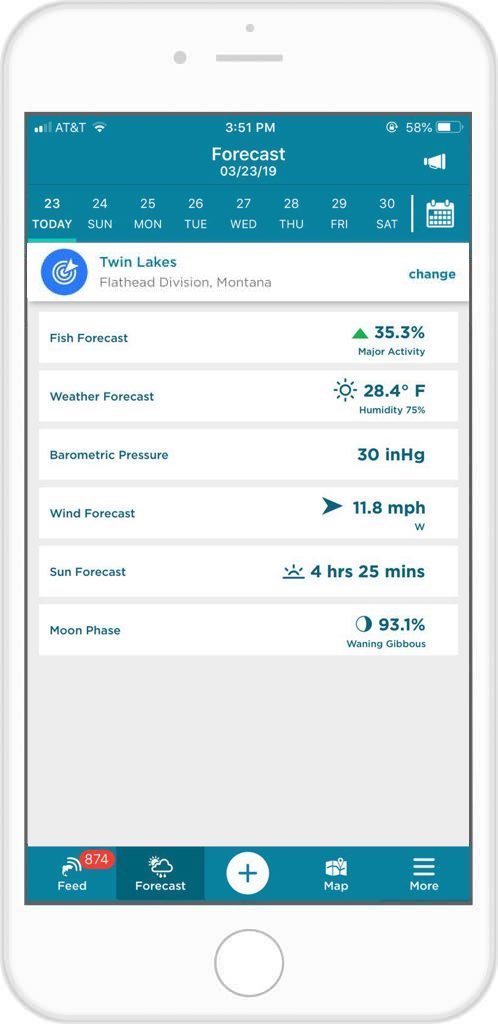 The Fish Forecast is shown as a probability in percentage form. The higher the percentage the stronger the current activity. The top of the screen will show the current percentage followed by moon phase score, moon distance score and solunar coincidence score. All factor in to calculating the solunar score. Below that are the minor and major activity time periods. Then we have the graph that shows the solunar activity for the day. The numbers on the left vertical side of the graph are the percentages of solunar activity. The bottom of the graph has time periods, by the hour, for the day. By taping on a time period, you can highlight the time period in light blue. The graph also slides to the left and right to make planning for the future easy.
For more FishAngler app Forecasting features, check out Best FishAngler App Features for Spring Fishing.
Tight lines!
– Christina A., Marine Biologist, FishAngler
Download the FishAngler app for FREE!