The forecast tells you what’s coming. Animated Weather Map Layers show you what’s happening — right now, right on your map. This guide walks you through every layer available to VIP Members, how to access them, and exactly how to use them to fish smarter. Whether you’re chasing bass on a freshwater lake or running offshore for mahi, there’s a layer built for your water.
Don’t have the FishAngler app yet? Download it for FREE now.
![]()

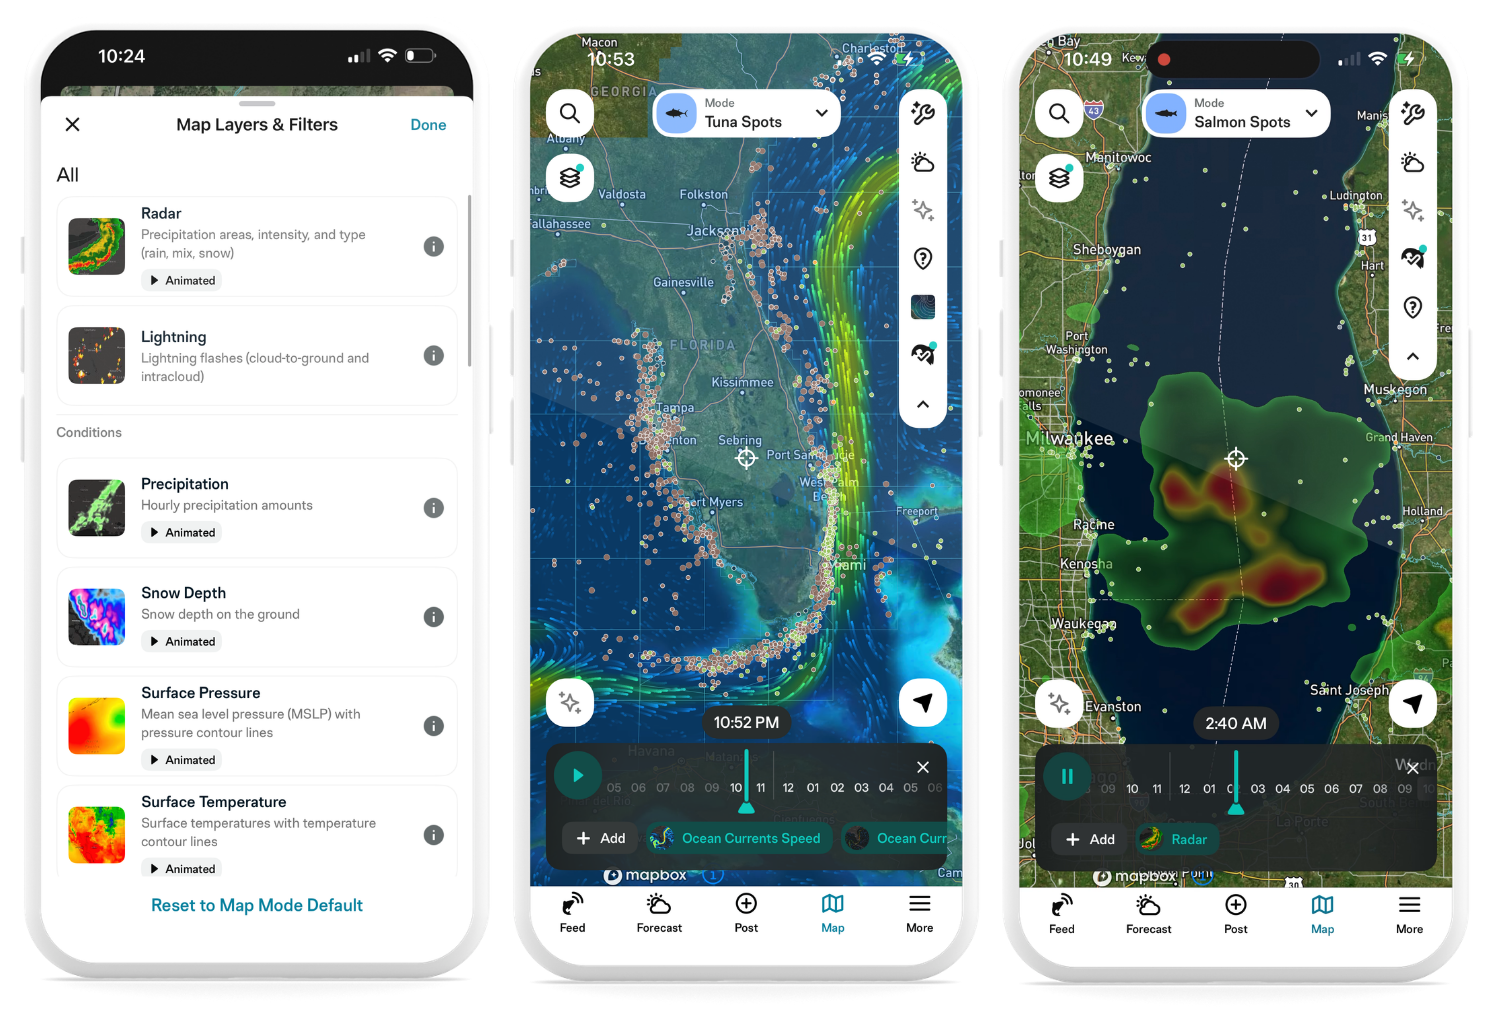
How to Open Animated Weather Layers
Getting started takes about three seconds:
- Open FishAngler and go to the map screen.
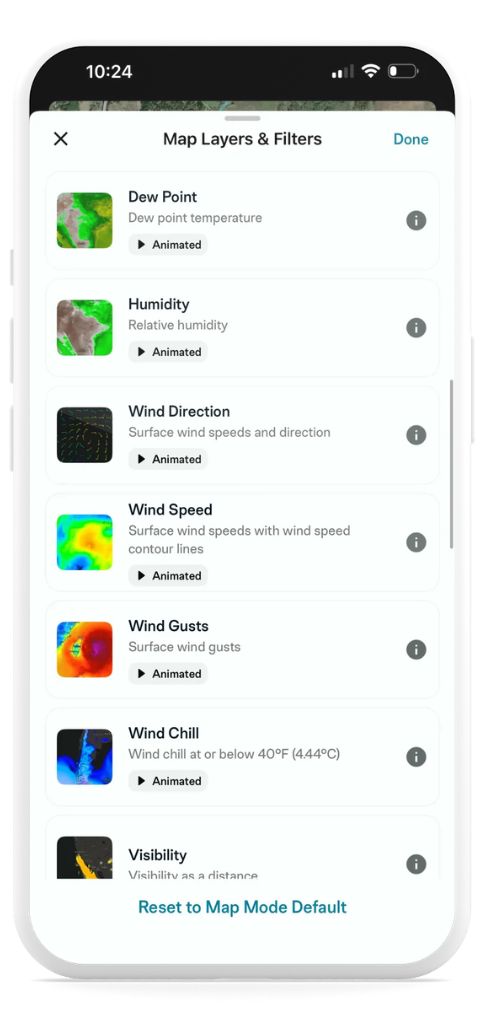
- Tap the layer icon in the upper left corner to open Map Layers & Filters.
- Scroll through the available layers and tap any one to apply it to your map.
- For animated layers, tap the play button at the bottom of the screen to watch conditions move over time. Use the timeline scrubber to step forward or backward through the forecast.
- Tap anywhere on the map while a layer is active to pull up a daily and hourly forecast for that exact location.
To reset back to your default map view, tap Reset to Map Mode Default at the bottom of the layers menu.
This is a VIP-exclusive feature. Not a VIP Member yet? Upgrade here to unlock it.
Weather Layers – What They Are and How to Use Them
Rain & Storms
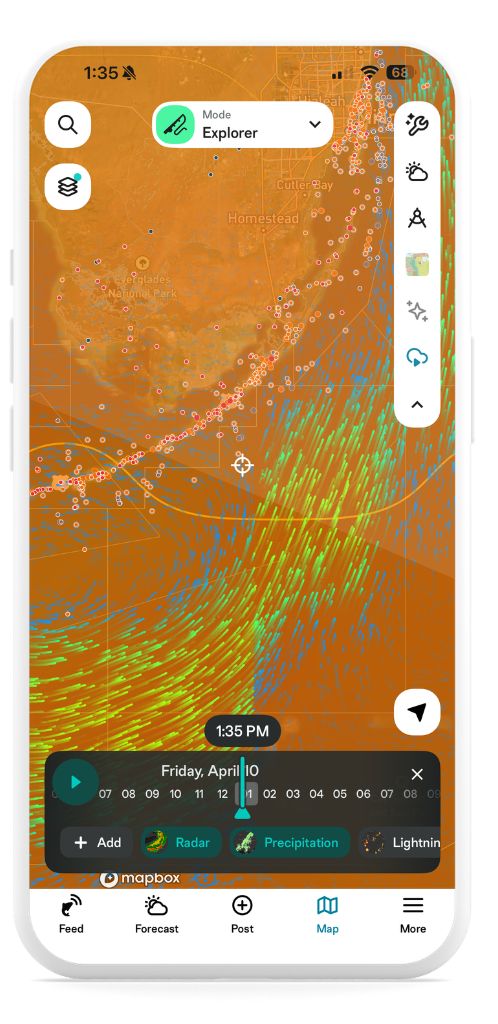
🌧️ Radar What it shows: Precipitation areas, intensity, and type — rain, mix, or snow — animated in real time. How to use it: Pull up radar before a trip to see whether a storm is building, moving through, or clearing. Watch the animation to judge timing — sometimes waiting an hour makes all the difference.
⚡ Lightning What it shows: Cloud-to-ground and intracloud lightning flashes as they occur. How to use it: Essential safety layer for open-water and offshore anglers. If strikes are moving toward your area, you’ll see it before you feel it.
🌦️ Precipitation What it shows: Hourly precipitation amounts, animated across the map. How to use it: Use alongside radar to see not just where rain is, but how much is coming down and when it’s going to ease up.
❄️ Snow Depth What it shows: Current snow depth on the ground. How to use it: Ice anglers and early-season river fishermen can use this to understand access conditions and how runoff might be affecting water levels downstream.
Wind Conditions
🌬️ Wind Direction What it shows: Surface wind speeds and direction, animated. How to use it: Watch where wind is pushing across a body of water. On lakes and reservoirs, baitfish get pushed downwind — and feeding bass follow. On the coast, wind direction determines which inlets are fishable and where current will be running strongest.
💨 Wind Speed What it shows: Surface wind speeds with wind speed contour lines. How to use it: Use this to plan your launch and your drift. Know what you’re heading into before you leave the dock. Pair with wind gusts for the full picture.
🌀 Wind Gusts What it shows: Surface wind gusts, animated. How to use it: Average wind speed and gust speed tell very different stories. A 15 mph wind with 30 mph gusts is a rough day offshore. This layer is critical for coastal and offshore anglers making a go/no-go call.
🥶 Wind Chill What it shows: Wind chill at or below 40°F. How to use it: Cold-weather anglers — this is your comfort and safety layer. Dress for the wind chill, not the air temp.
Atmosphere & Conditions
🔵 Surface Pressure What it shows: Mean sea level pressure (MSLP) with pressure contour lines, animated over time. How to use it: Falling pressure generally signals incoming weather and slower fishing. Rising pressure typically means improving conditions and more active fish. Watch how pressure tracks across your area and cross-reference it with your Fish Forecast to understand why certain bite windows are rated higher than others.
🌡️ Surface Temperature What it shows: Air temperatures across the map with temperature contour lines. How to use it: Cold fronts show up clearly as temperature breaks on this layer. Fish behavior shifts dramatically around frontal passages — use this to anticipate the change and adjust your approach.
💧 Dew Point What it shows: Dew point temperature across your area. How to use it: High dew points combined with falling temperatures can create foggy morning conditions on the water. Plan your launch time accordingly.
☁️ Humidity What it shows: Relative humidity, animated. How to use it: High humidity paired with rising temperatures is a common setup for afternoon thunderstorms. Use alongside the radar and lightning layers on warm summer days.
Sky & Visibility
🛰️ Satellite Visible What it shows: Real visible satellite imagery overlaid on your map. How to use it: See cloud systems, fronts, and clearing windows exactly as they appear from above. Great for getting a big-picture read on what the atmosphere is doing before zooming into other layers.
🌥️ Cloud Coverage What it shows: Cloud cover as a percentage, animated. How to use it: Overcast days can improve topwater and shallow-water fishing by reducing light penetration. Partly cloudy conditions often produce the best sight-fishing windows. Use this to time your approach.
👁️ Visibility What it shows: Visibility as a distance across your area. How to use it: Fog on the water can close in fast. Check this layer before early morning launches, especially in coastal areas where tule fog or sea fog is common.
☀️ UV Index What it shows: Ultraviolet index (UVI) by location and hour. How to use it: Know when sun exposure peaks during your day on the water — and plan your sun protection accordingly.
Marine Layers
Ocean Temperatures & Currents
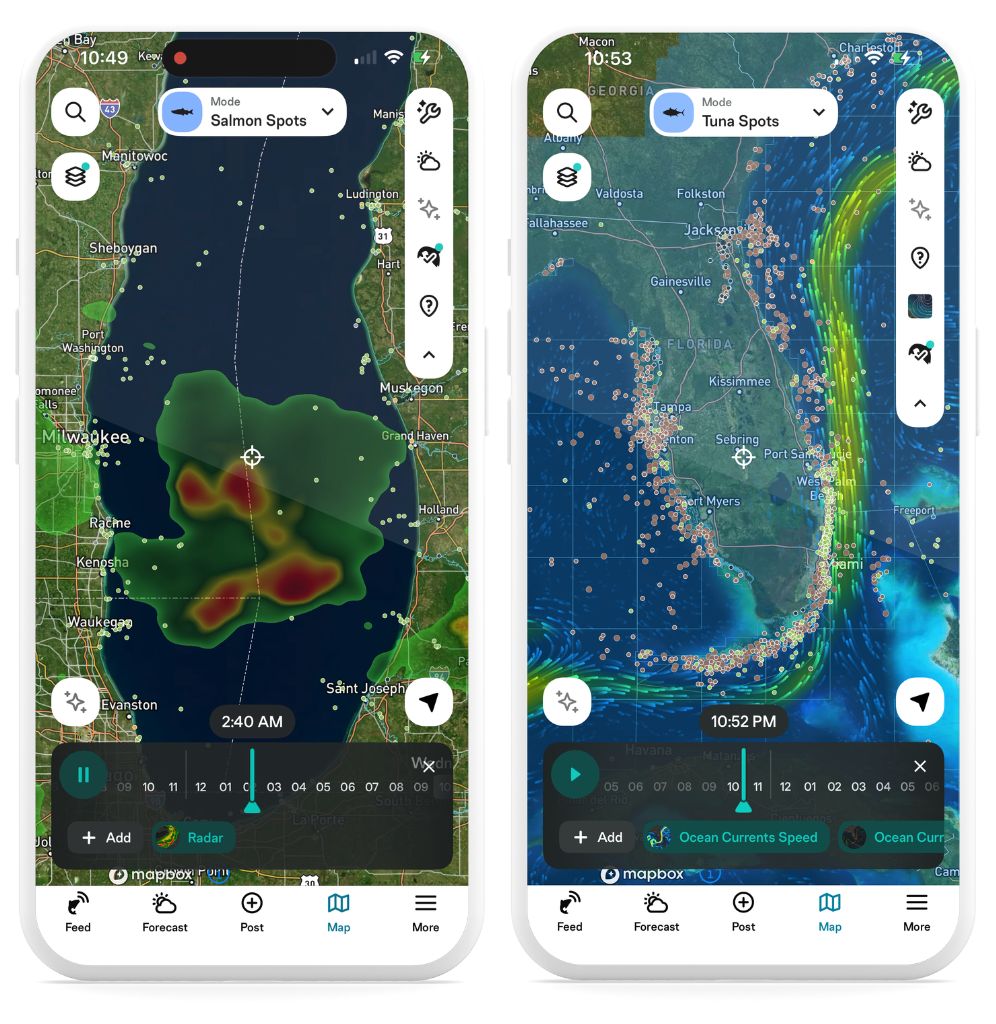
🌊 Sea Surface Temperature What it shows: Ocean surface temperature, animated. How to use it: This is one of the most valuable layers for saltwater anglers. Find the temperature breaks — the edges where warm and cold water meet — and you’ll find bait. Find the bait, and predators are close behind. Offshore species like mahi, wahoo, and tuna stack on these edges. Nearshore species like snook and redfish respond to temperature changes too, especially after cold fronts.
🔄 Ocean Currents Direction What it shows: Ocean current speeds and direction, animated. How to use it: Currents move bait and create feeding ambush points. Watch where current lines and edges form — fish position themselves to intercept food with minimal effort. This layer is especially valuable for offshore drift fishing and identifying productive rip lines.
⬆️ Ocean Currents Speed What it shows: Ocean current speeds, animated. How to use it: Strong currents can make anchoring difficult and affect presentation. Use current speed alongside direction to plan your drift and understand where fish are likely holding.
Waves & Swells
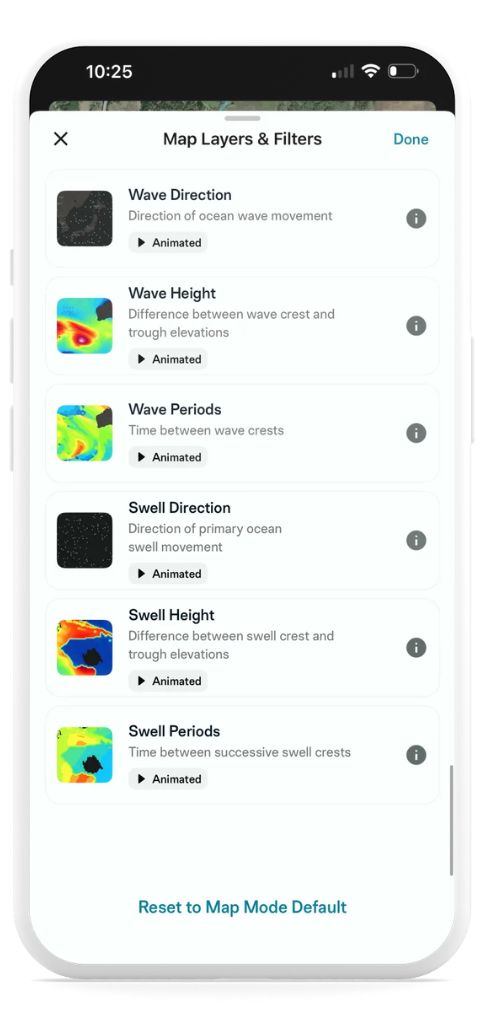
↗️ Wave Direction What it shows: Direction of ocean wave movement, animated. How to use it: Wave direction determines which inlets, passes, and coastal areas are fishable on a given day. Waves coming against an outgoing tide can create dangerous conditions in narrow cuts. Know before you go.
📏 Wave Height What it shows: The difference between wave crest and trough, animated. How to use it: Your comfort and safety threshold on the water depends on your boat. Use wave height to make informed go/no-go decisions on coastal and offshore trips.
⏱️ Wave Periods What it shows: Time between wave crests. How to use it: Longer periods mean more organized, easier-to-manage seas — even if height looks significant. Short periods with steep waves are rougher to run in. Use this alongside wave height for the full picture.
🧭 Swell Direction What it shows: Direction of primary ocean swell movement. How to use it: Swell direction tells you how energy is entering your fishing area. Surf anglers use this to read which beaches and jetties are producing. Nearshore anglers use it to identify protected water.
📐 Swell Height What it shows: Difference between swell crest and trough. How to use it: Layer swell height with wave height to get a complete read on offshore sea state. Big swells plus short wave periods equals a rough, uncomfortable day. Big swells with long periods can be manageable — and the fishing can be excellent.
⏳ Swell Periods What it shows: Time between successive swell crests. How to use it: Use swell period alongside swell height to judge whether conditions are worth the run. Long-period swells are generally more fishable than short-period chop at the same height.
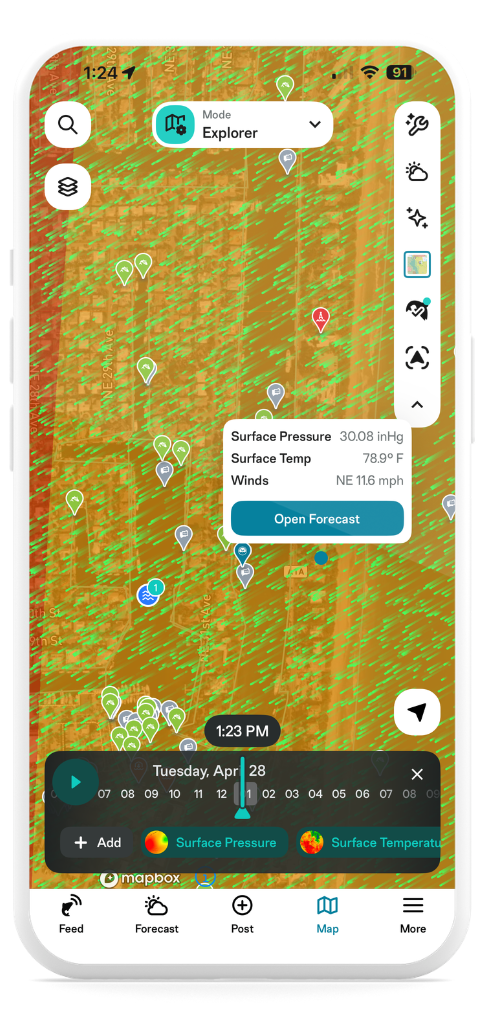
Pro Tip: Tap Anywhere for an Instant Readout
While any animated weather layer is active, tap anywhere on the map to get a live conditions snapshot for that exact location based on whichever layer you have enabled. Tap Open Forecast to dive deeper into the full daily and hourly forecast for that spot.
It’s one of the most useful things about animated layers — you’re not just watching conditions move across the map, you’re able to interrogate any point on it in real time. Scouting a new spot offshore? Tap it. Wondering what conditions look like two bays over? Tap it.
You’re Ready to Read the Water
That’s every animated weather layer currently available to VIP Members — from radar and lightning to sea surface temperature, ocean currents, and wave swells. Each one gives you a different window into what the water and sky are doing. Together, they give you a level of situational awareness that used to require a weatherman and a captain.
Start with the layers most relevant to your water. Add more as you get comfortable. The more you use them, the faster conditions start to make sense — and the better your decisions become before you ever leave home.
New to FishAngler? Download the app for FREE and start fishing smarter.
![]()