Knowing the forecast before you launch is one thing. Watching conditions move across your map in real time is something else entirely. FishAngler VIP Members can now access Animated Weather Map Layers — live, animated weather and marine data overlaid directly on your map, so you can see exactly what’s happening on the water before you ever get there.
Don’t have the FishAngler app yet? Download it for FREE now.
![]()
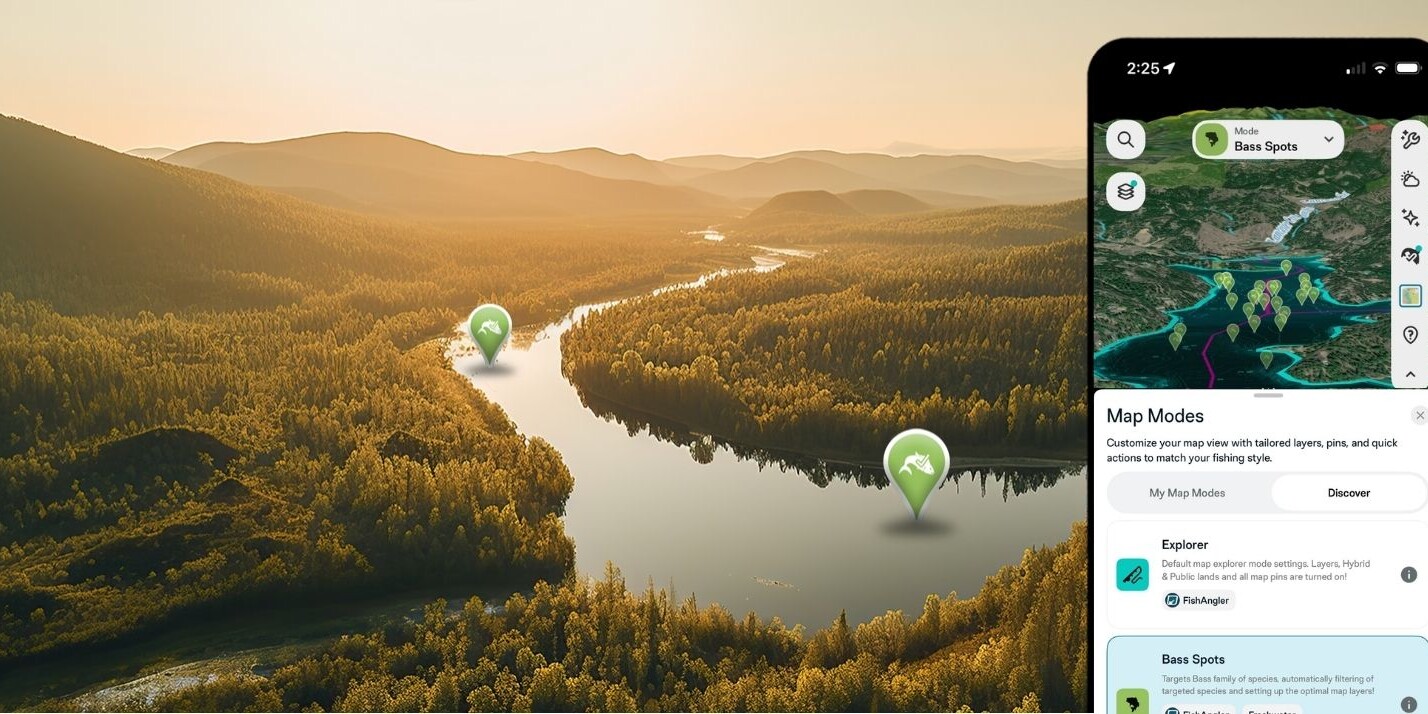
See the Weather. Don’t Just Read It.
Static numbers and condition summaries will only get you so far. Wind direction means more when you can watch it shift across a bay over the next six hours. Sea surface temperature matters more when you can see exactly where warm water pushes against cold along the coast you’re about to run. Animated layers give you that picture — and that picture changes how you fish.
This is one of the most powerful tools we’ve ever put on the map. It’s exclusive to VIP Members — and once you see it in action, you’ll understand why. Not a VIP Member yet? Upgrade here to unlock it.
How to Access Animated Weather Layers
Getting there is simple:
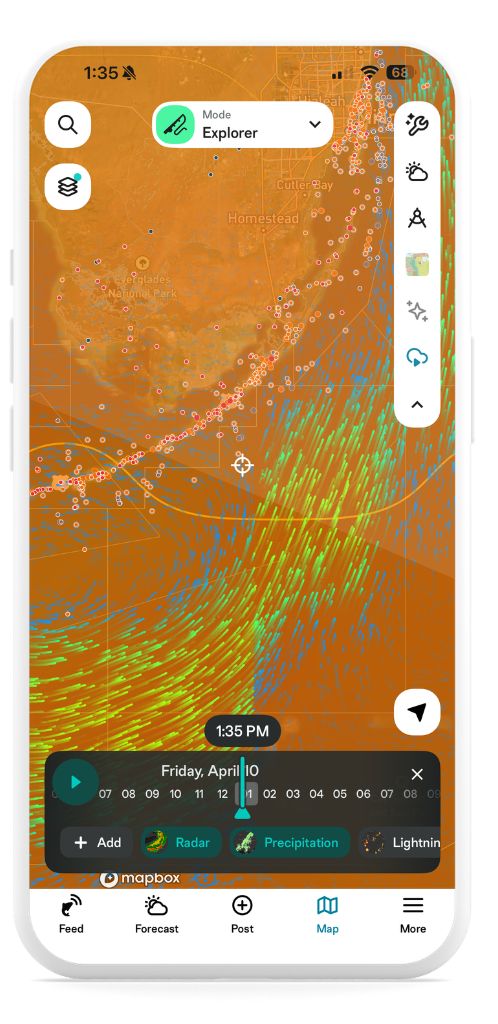
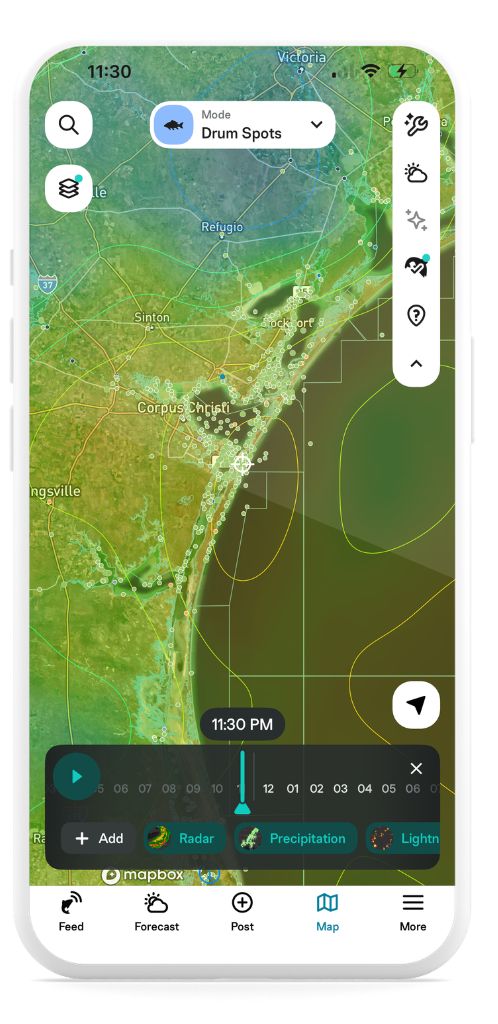
- Open FishAngler and go to the map screen.
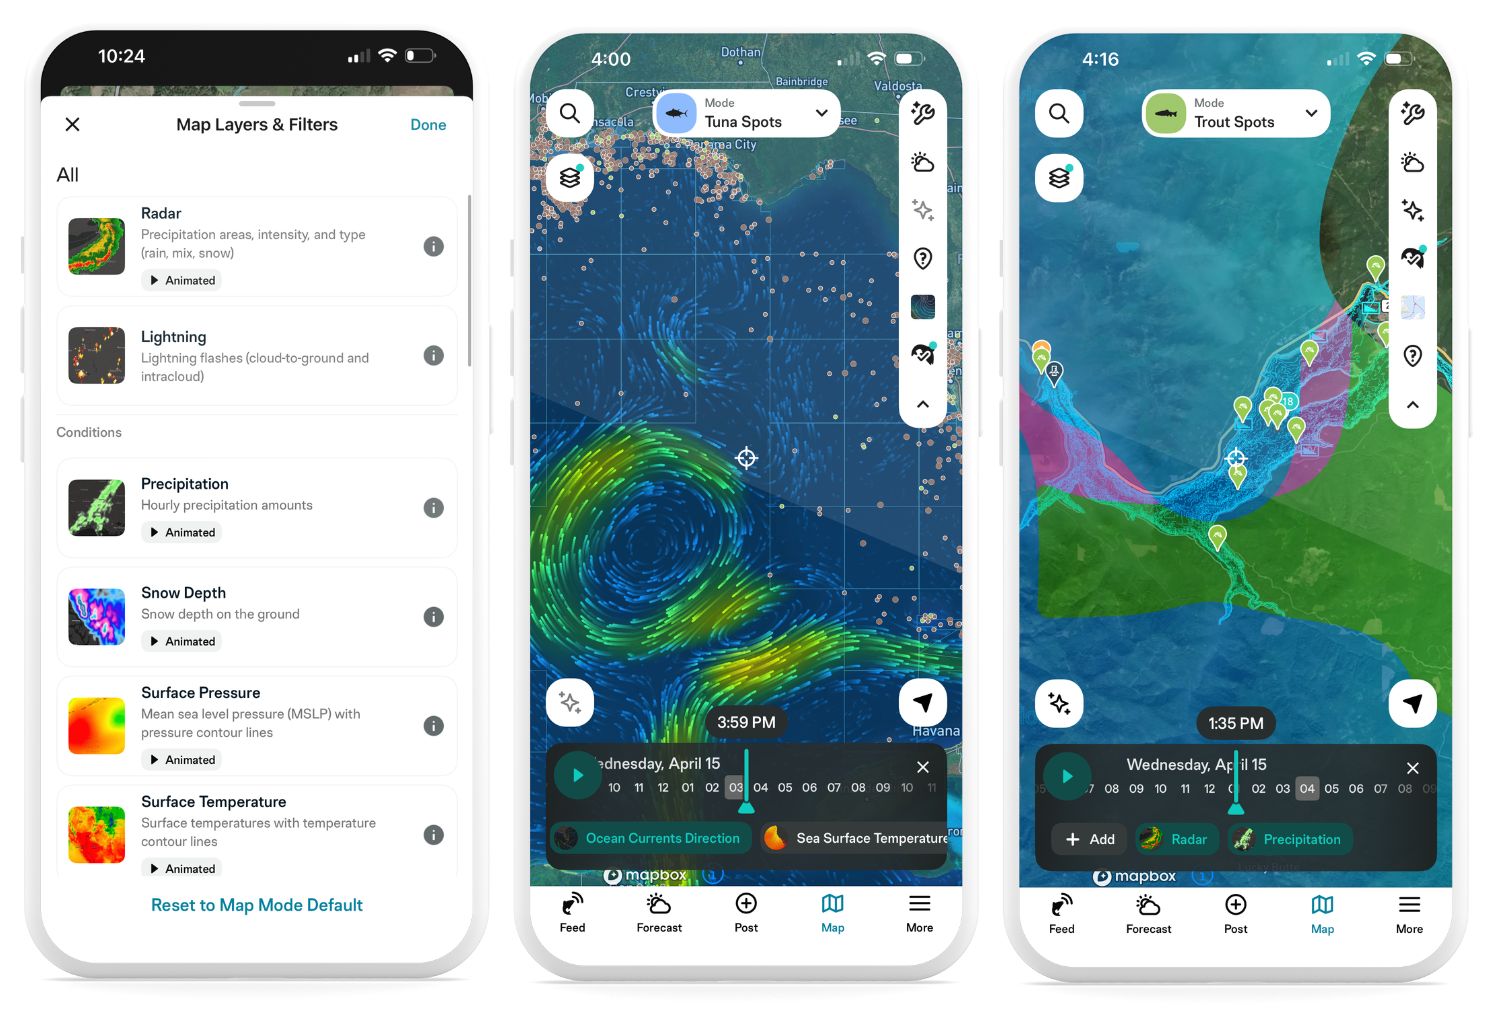
- Tap the layer icon in the upper left corner to open Map Layers & Filters.
- Select any layer to apply it to your map.
- Most layers are animated — tap play and watch conditions unfold over time.
Tap anywhere on the map while a layer is active to pull up a forecast for that exact location.
What’s Available
There are two categories of layers — Weather and Marine. Here’s everything currently available:
Weather Layers
- Radar — Watch precipitation move across your area in real time. See intensity and type — rain, mix, or snow — as it develops.
- Lightning — Track cloud-to-ground and intracloud lightning flashes as they occur. Critical for offshore and open-water anglers.
- Precipitation — Hourly precipitation amounts shown as an animated overlay, so you can see when rain is building or breaking.
- Snow Depth — Current snow depth on the ground. Useful for ice anglers and early-season river fishing.
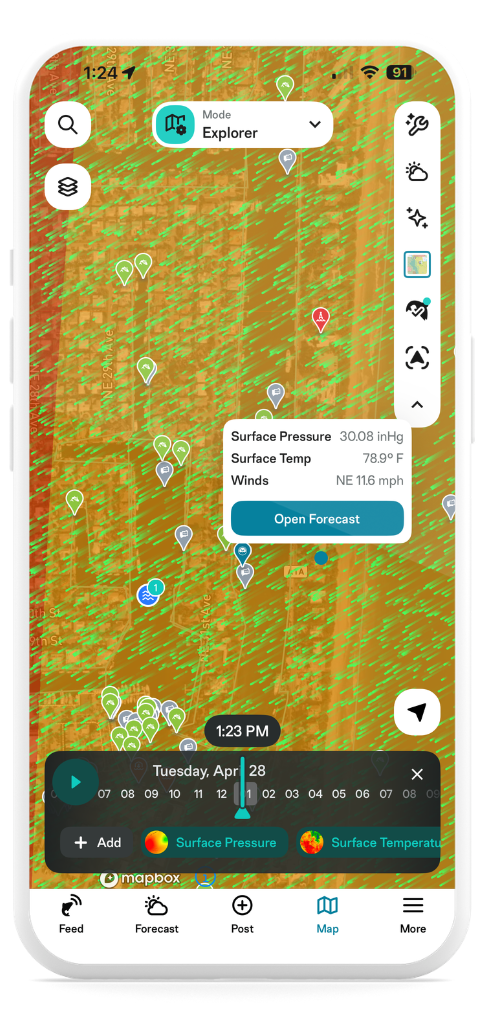
- Surface Pressure — Mean sea level pressure with contour lines, animated over time. Pair this with your Fish Forecast to understand why bite windows shift.
- Surface Temperature — Air temps across the map with temperature contour lines. A quick read on what kind of day you’re stepping into.
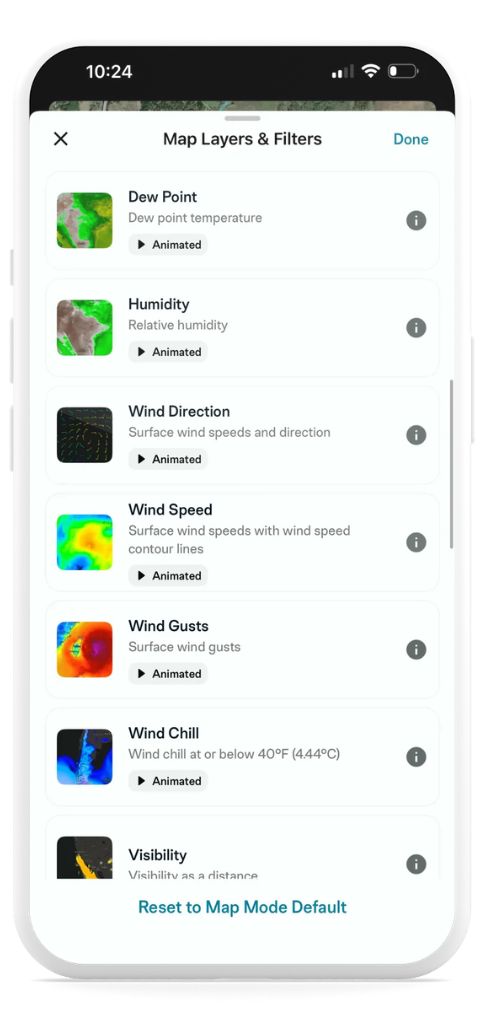
- Dew Point — Dew point temperature across your area.
- Humidity — Relative humidity as an animated layer.
- Wind Direction — Watch surface winds move in real time. See exactly where wind is pushing bait — and where feeding fish are likely to follow.
- Wind Speed — Surface wind speeds with contour lines. Know what you’re heading into before you launch.
- Wind Gusts — Surface wind gust data, animated. Offshore anglers — this one matters.
- Wind Chill — Wind chill conditions at or below 40°F. Cold-weather fishing planning made simple.
- Visibility — Visibility as a distance. Fog on the water is no surprise when you can see it rolling in.
- Satellite Visible — Real visible satellite imagery overlaid on your map. See cloud systems, fronts, and clearing windows exactly as they appear from above.
- Cloud Coverage — Cloud cover as a percentage across your fishing area, animated over time.
- UV Index — Ultraviolet index (UVI) by location and hour. Know when you need to cover up.
Marine Layers
- Sea Surface Temperature — See exactly where warm and cold water meet. Target the temperature breaks where bait stacks and predators follow.
- Ocean Currents Direction — Watch current direction and speed animate across coastal and offshore waters. Find the edges and eddies where fish hold.Ocean Currents Speed — Current speed data displayed as a live layer. Essential for drift fishing and offshore planning.
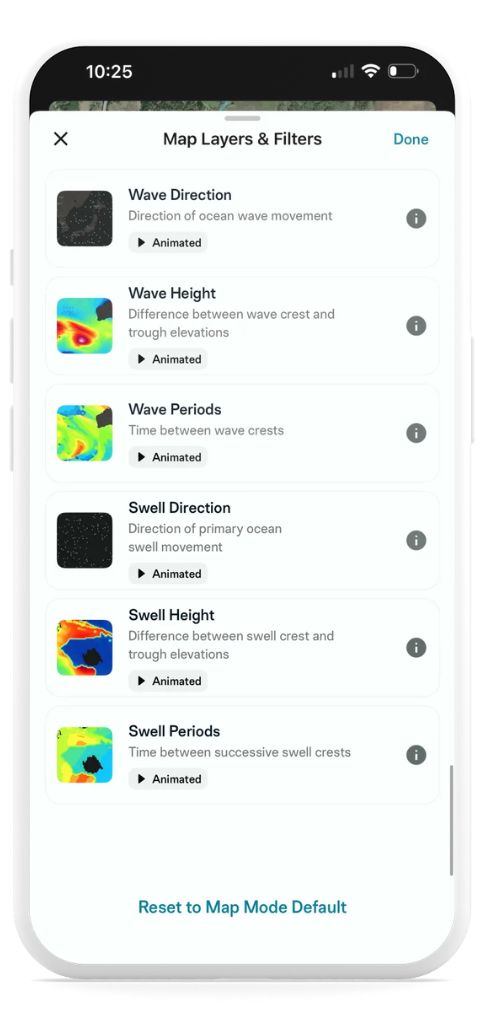
- Wave Direction — Direction of ocean wave movement, animated. Know what you’re heading into on a coastal or offshore run.
- Wave Height — The difference between wave crest and trough, displayed live on your map. Plan your trip around safe, comfortable conditions.
- Wave Periods — Time between wave crests. Longer periods generally mean more organized seas — and a more comfortable ride.
- Swell Direction — Direction of primary ocean swell movement. Critical for surf fishing and nearshore planning.
- Swell Height — Difference between swell crest and trough. Layer this with wave height for a full picture of offshore sea state.
- Swell Periods — Time between successive swell crests. Use this alongside swell height to judge whether conditions are fishable.
Pro Tip: Tap Anywhere for an Instant Readout
While any animated weather layer is active, tap anywhere on the map to get a live conditions snapshot for that exact location based on whichever layer you have enabled. Tap Open Forecast to dive deeper into the full daily and hourly forecast for that spot.
It’s one of the most useful things about animated layers — you’re not just watching conditions move across the map, you’re able to interrogate any point on it in real time. Scouting a new spot offshore? Tap it. Wondering what conditions look like two bays over? Tap it.
 Why It Matters on the Water
Every layer exists because it affects where fish are, when they feed, and whether you can safely get to them. A radar layer tells you whether to wait out a storm or run before it arrives. A sea surface temperature layer shows you the edge that’s been holding mahi all week. A wind layer shows you which bank will have feeding bass pushed against it by afternoon.
The anglers who consistently put fish in the boat aren’t just lucky — they’re informed. Animated Weather Map Layers are built to keep you that way.
 Get Started Today
Open the app, tap the layer icon on your map, and start exploring. The water is always telling you something — now you can watch it in real time.
New to FishAngler? Download the app for FREE and start fishing smarter.
![]()